
The first powerful earthquake was only the beginning. In the days after Panama’s magnitude 7.7 earthquake on October 9, strong shocks continued in central Panama while another cluster drew attention on the Caribbean side of the country.
One part of the story stands out near Santa Catalina: two large earthquakes west of Río Grande, followed by more shaking in the same area. Farther west, events near Chiriquí Grande have raised questions for people in Bocas del Toro and Almirante. With Volcán Barú nearby in the Chiriquí highlands, it is understandable that residents are asking how these observations fit together.
The most useful starting point is geography. The central-Panama sequence and the western activity occupy different areas. Their timing deserves study, but a busy earthquake map alone cannot tell us whether one group triggered another—or whether a volcano is becoming restless.
A powerful start, followed by more strong shaking
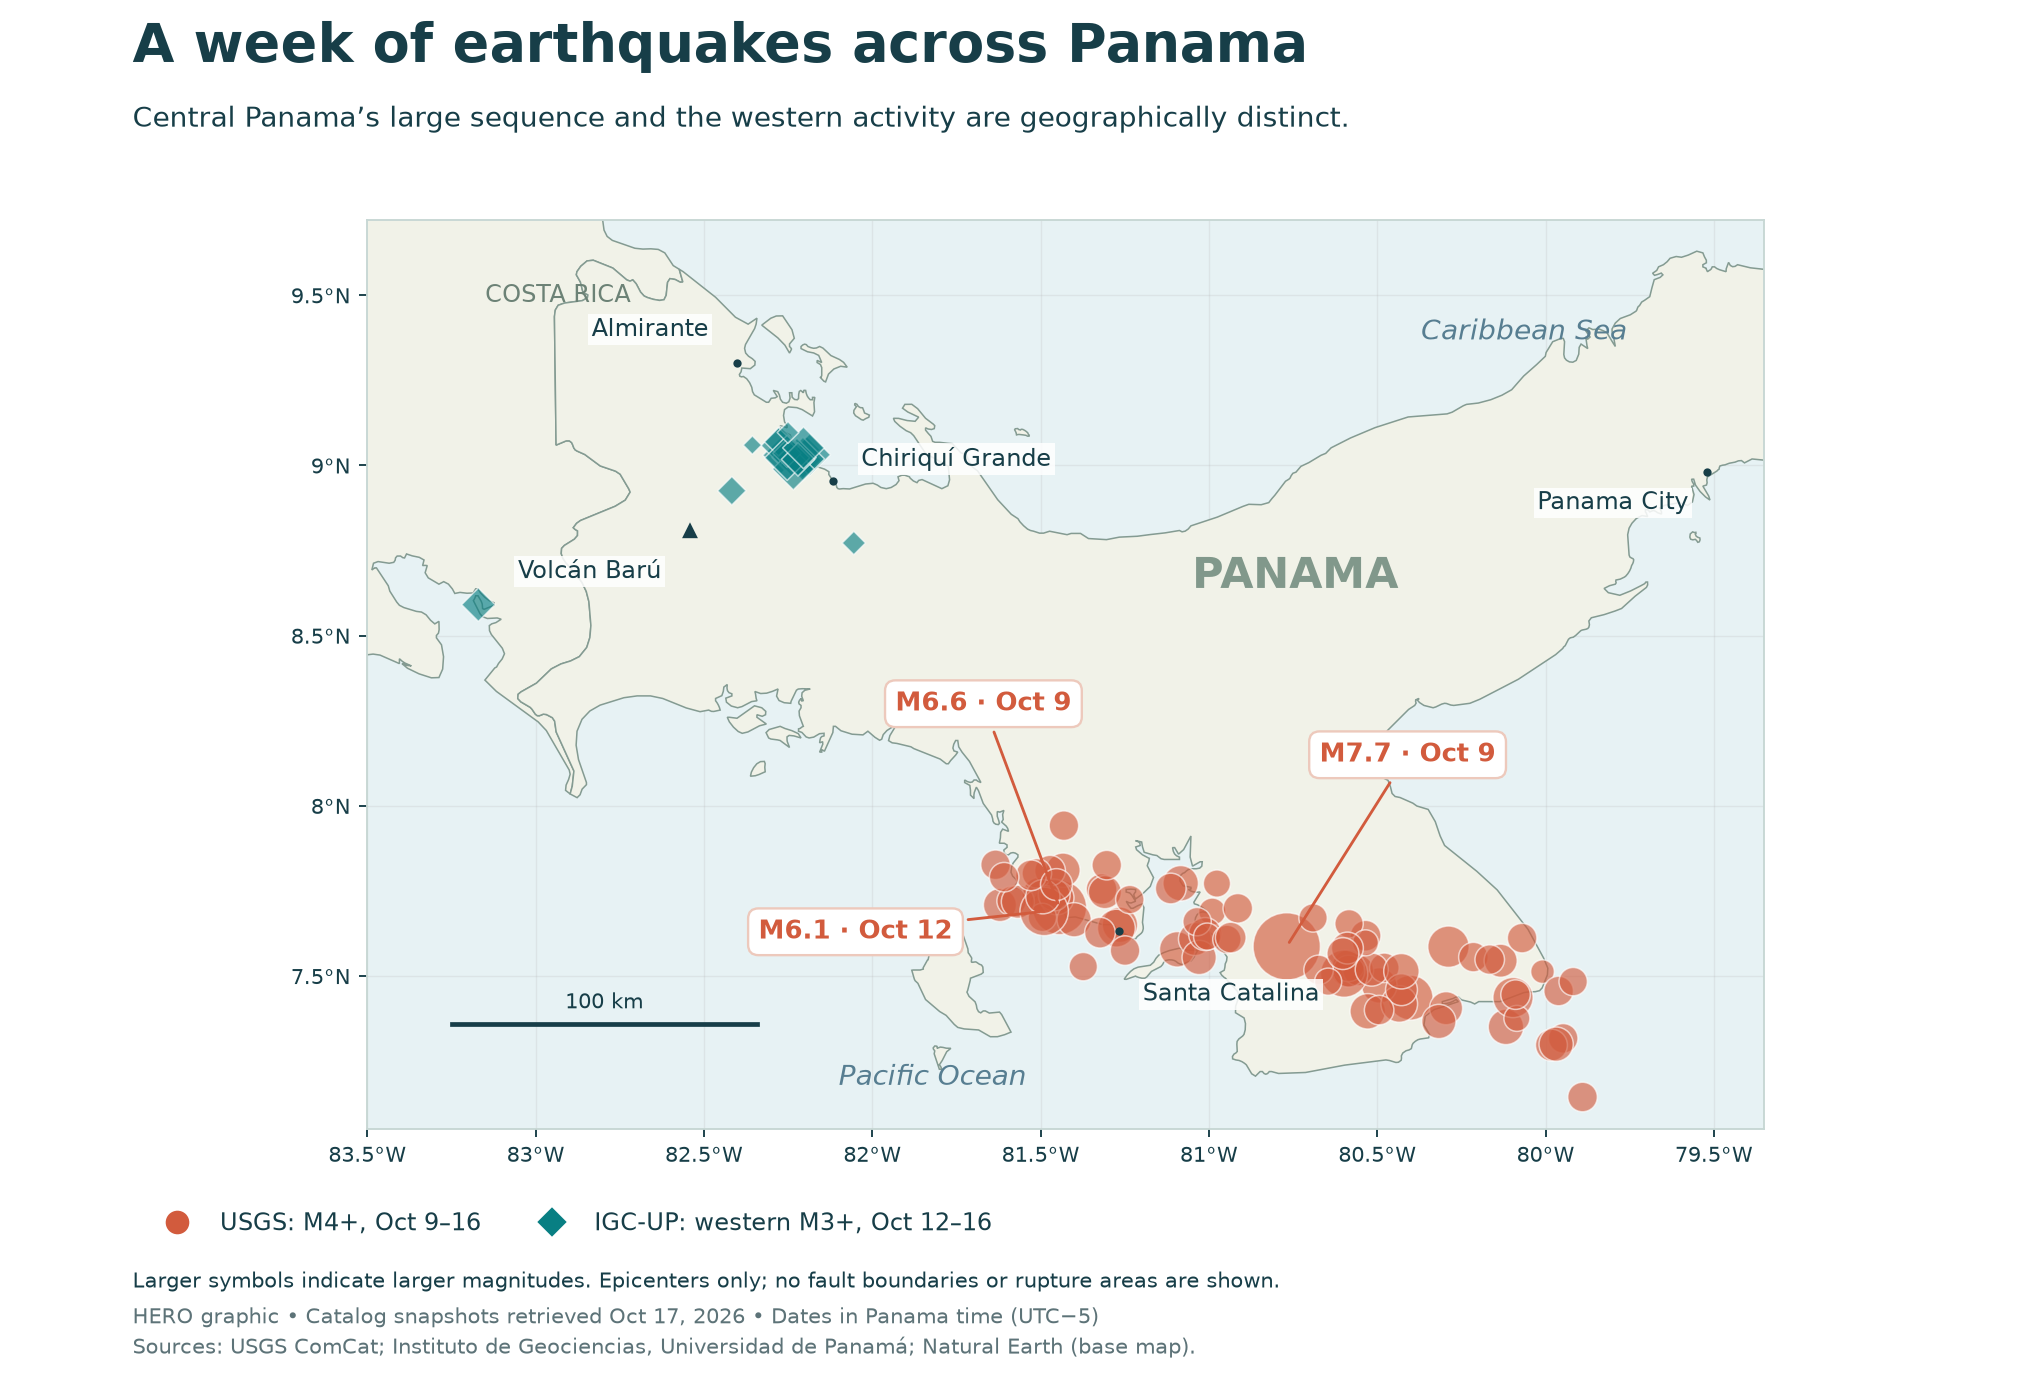
The U.S. Geological Survey places the October 9 mainshock near Pitaloza Arriba, in the Azuero region. Its reviewed magnitude is 7.7 and its depth about 13 kilometers. It struck at 12:56 p.m. Panama time. About two and a half hours later, a magnitude 6.6 earthquake occurred farther west, near Río Grande in Veraguas. USGS: October 9 mainshock · USGS: magnitude 6.6 event.
Shaking continued through the night and into the following week. The catalog includes a magnitude 6.0 near La Tronosa late on October 9, followed on October 12 by another strong Veraguas earthquake, magnitude 6.1. These larger events sit within a much wider field of smaller earthquakes.
Why the Santa Catalina area stands out
The magnitude 6.6 earthquake on October 9 and the magnitude 6.1 on October 12 occurred close to one another, west of Río Grande and roughly 20–25 kilometers west-northwest of Santa Catalina. On a regional map, this group forms a distinct western part of the central-Panama sequence.
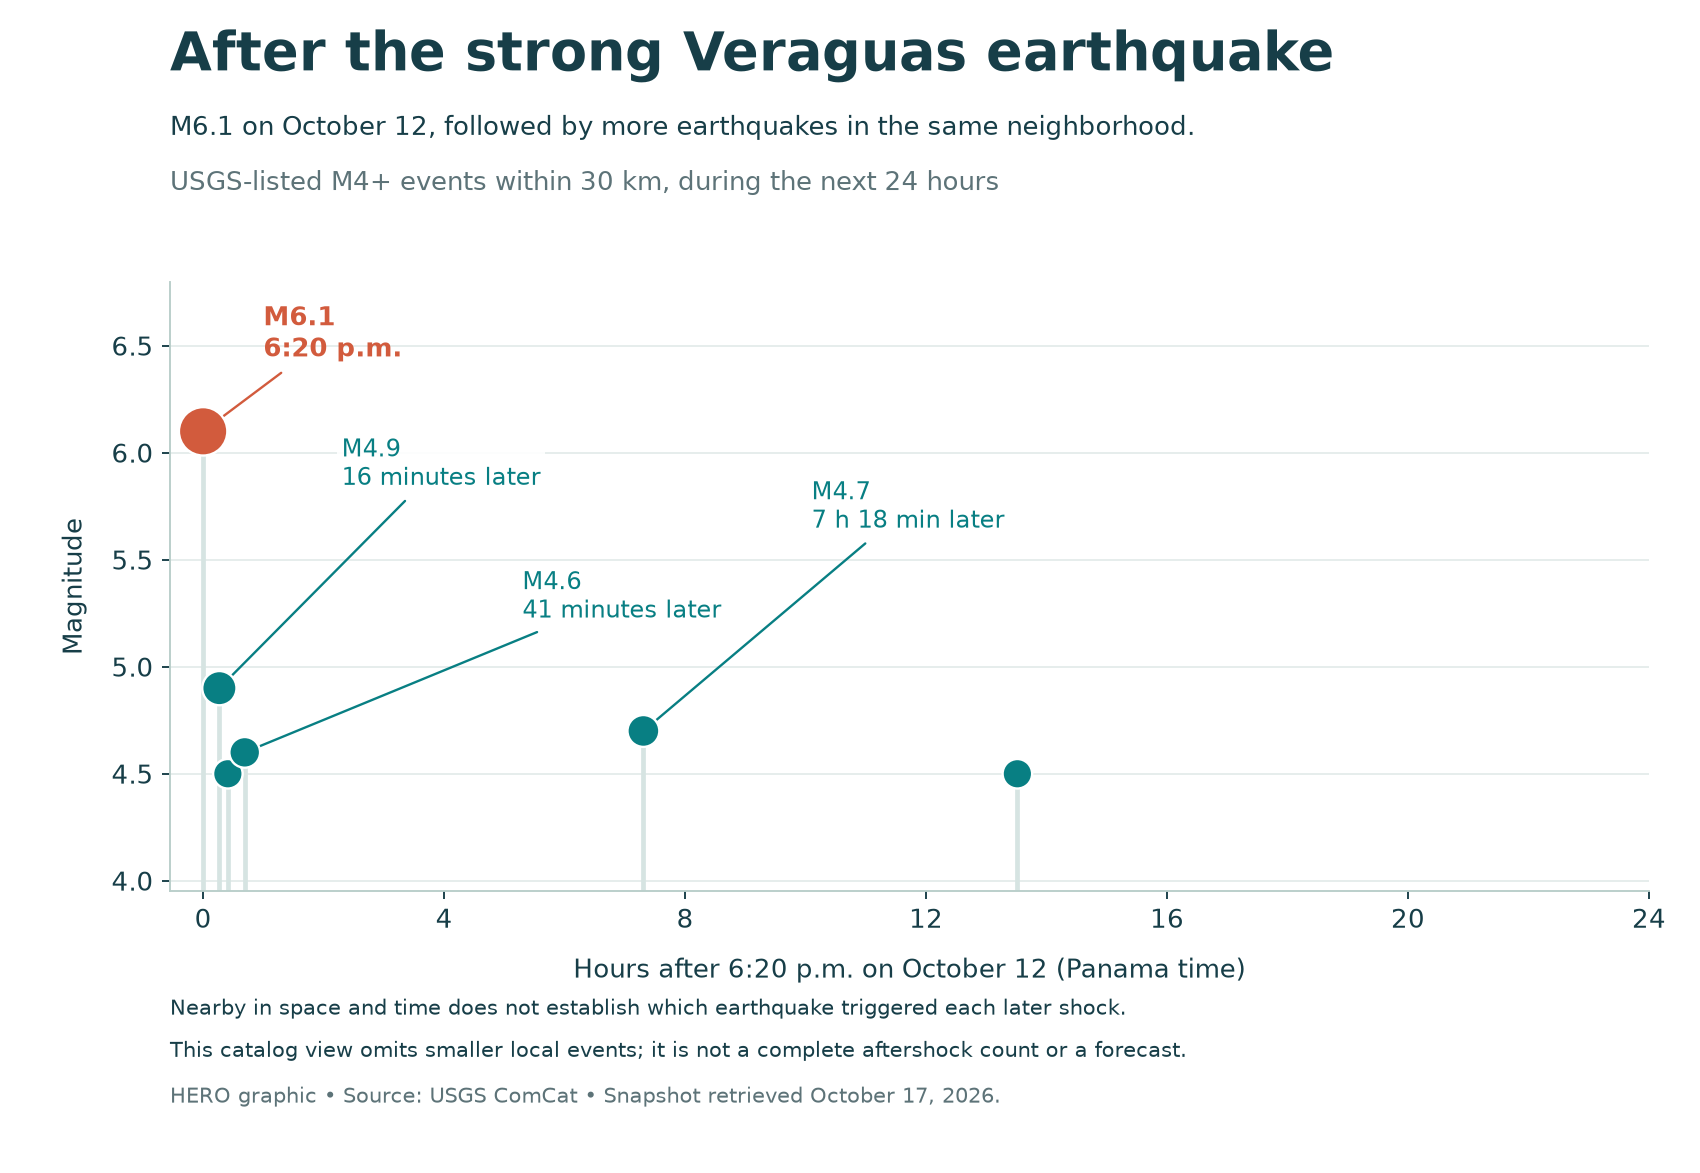
The October 12 earthquake struck at 6:20 p.m., at a depth of about 11 kilometers. More earthquakes appeared nearby almost immediately. USGS records include:
- 6:36 p.m.: magnitude 4.9, about 16 minutes after the magnitude 6.1.
- 7:02 p.m.: magnitude 4.6, about 41 minutes later.
- 1:39 a.m. on October 13: magnitude 4.7, about seven hours later.
These events were within about 30 kilometers of the magnitude 6.1 epicenter. Other nearby shocks also appear in the catalog. USGS: October 12 magnitude 6.1 · Magnitude 4.9 · Magnitude 4.6 · Magnitude 4.7.
A strong aftershock can be followed by a fresh burst of smaller earthquakes. That helps explain why a sequence can feel as though it has started again. Aftershocks are earthquakes in their own right, and some can cause further damage. Their overall frequency usually declines with time, although activity can rise again around a larger shock. Establishing the connection between particular events requires more than plotting their locations. USGS: understanding aftershocks · Aftershock forecasts.
Activity toward Almirante and the Costa Rica border
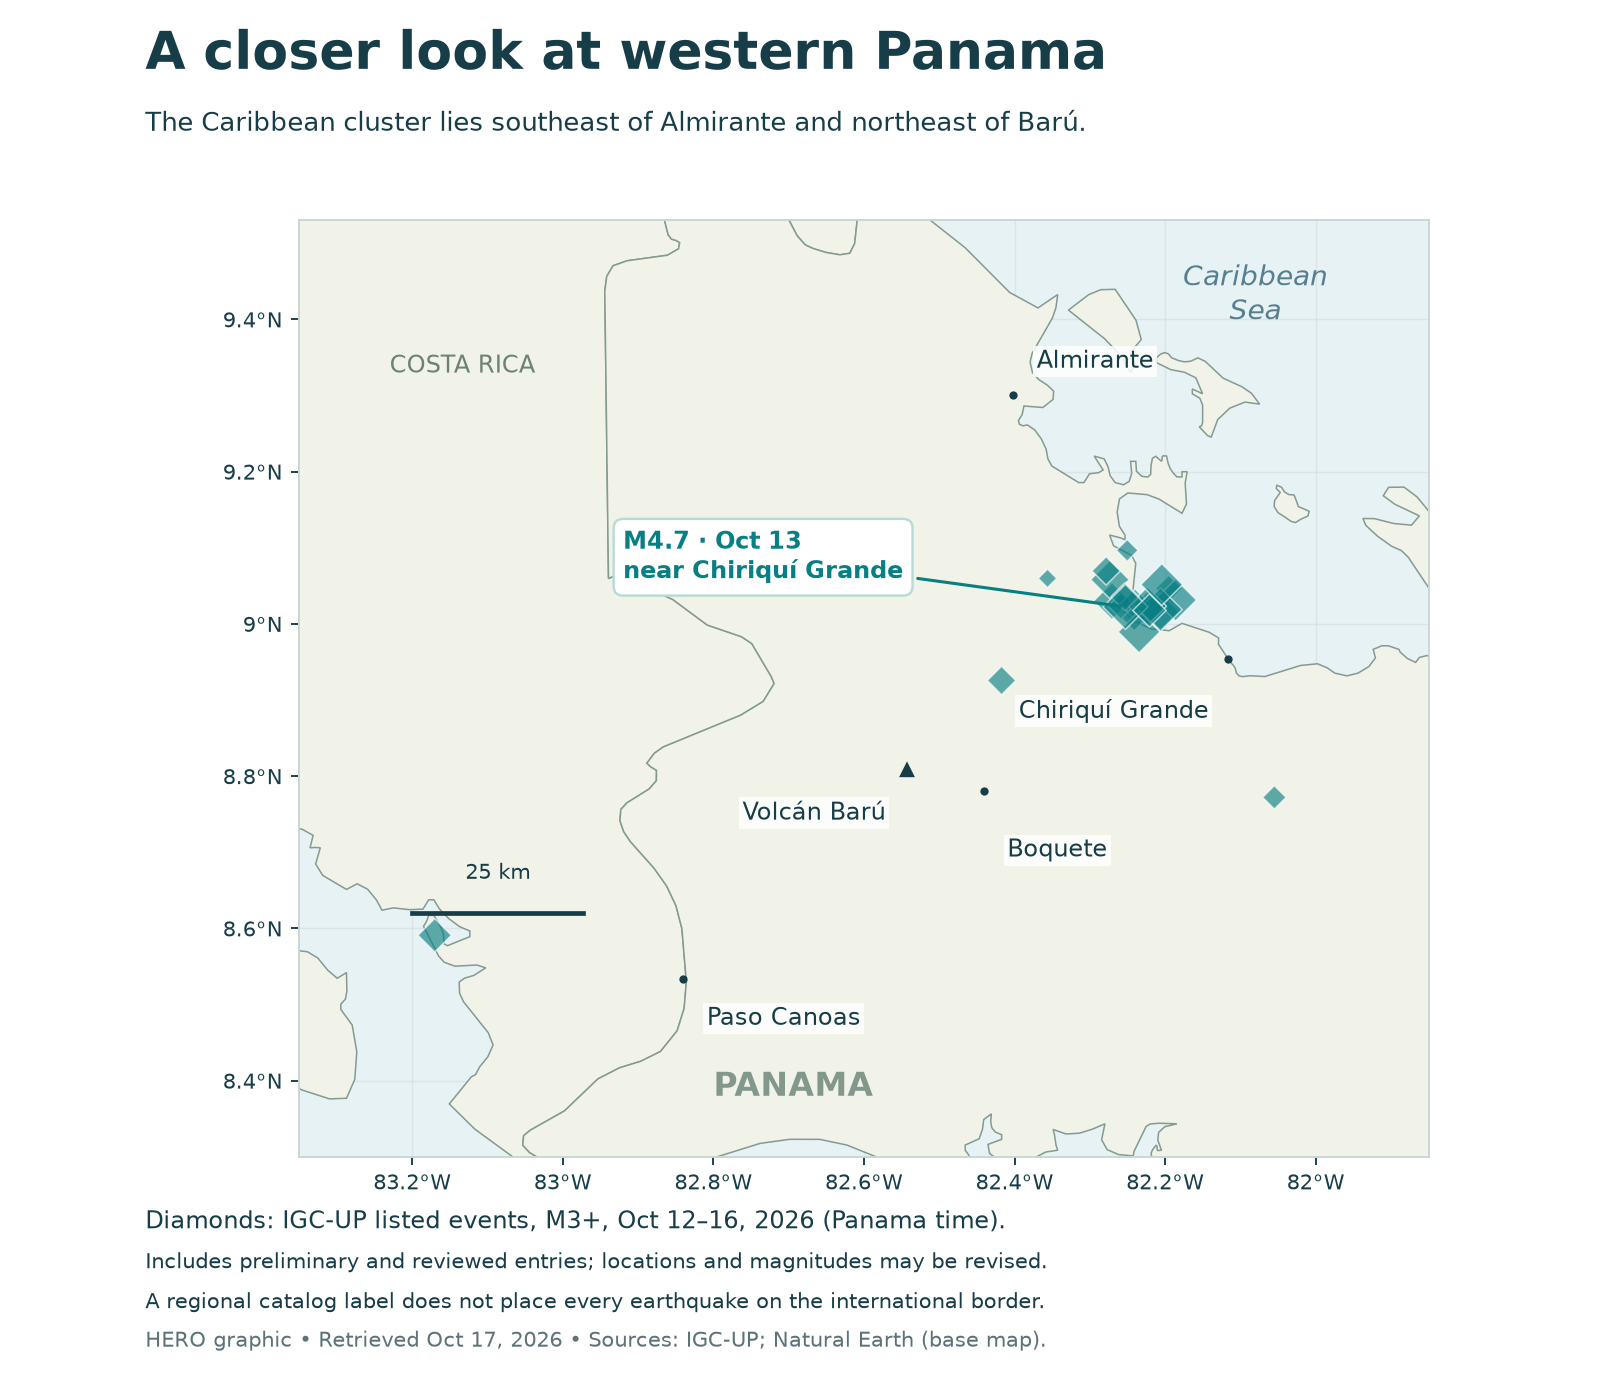
The Caribbean side deserves attention, too. Panama’s Instituto de Geociencias lists repeated events near Chiriquí Grande on October 12–14. Examples include a reviewed magnitude 4.5 on October 12 and a reviewed magnitude 4.7 at noon on October 13, the latter located about 17 kilometers northwest of Chiriquí Grande.
This cluster lies southeast of Almirante and northeast of Barú. The catalog groups many entries under the broad label “Panama–Costa Rica border region”; the individual locations are more precise. The same listing also includes a preliminary magnitude 4.0 in Costa Rica, west of Paso Canoas, late on October 16. IGC-UP earthquake listing.
For someone feeling repeated shaking in Almirante, that northern activity is understandably striking. Calling it statistically unusual would require a consistent comparison with earlier local records, including their ability to detect small earthquakes. Bocas del Toro has a significant earthquake history: Panama’s fire service recalls the damage there during the 1991 Limón earthquake. The 1991 earthquake in Bocas del Toro.
These observations give researchers a reason to examine the western activity closely. Demonstrating that the October 9 mainshock caused a particular border-region earthquake would require a scientific analysis of faults, timing and stress changes.
What does this mean for Volcán Barú?
Barú is a potentially active volcano. The Smithsonian Global Volcanism Program lists its last known eruption around 1550. A USGS assessment documents earlier eruptions and seismic swarms, including one in 2006, making long-term monitoring important. Smithsonian: Barú · USGS: Barú’s eruptive history and hazards.
The October 9 magnitude 7.7 epicenter is roughly 240 kilometers from Barú. The Caribbean cluster is closer, but its mapped concentration is northeast of the volcano. Location is one part of the evidence: scientists also examine earthquake depths and waveforms, changes through time, ground deformation, gas emissions and temperature measurements. How scientists monitor volcanoes.
A regional earthquake catalog cannot, by itself, diagnose volcanic unrest or establish the probability of an eruption. Equally, the absence of a recent entry on an international volcano-reporting page should not be treated as an official local assessment. Current monitoring and announcements from the responsible agencies remain essential.
HERO’s water-temperature research near Boquete
In notes supplied for this article on October 14, HERO reported daily temperature monitoring of underground water sources near Volcán Barú, including the Caldera River basin. HERO reported no significant recent temperature variation in those observations.
There is a scientific reason to watch water. Changes in groundwater chemistry, temperature and flow can help researchers understand a volcano’s hydrothermal system. The USGS monitors such conditions at volcanoes in the Cascade Range, interpreting them alongside other measurements. USGS: water chemistry and temperature monitoring.
HERO’s observations are part of an ongoing research effort. Stable temperatures at a monitored source offer useful local context, but they cannot establish the condition of an entire volcano or predict an earthquake. A useful record needs a baseline, consistent instruments and an understanding of seasonal and weather-related changes.
Keep watching the sequence—and the sources
The strong Veraguas shocks, the smaller earthquakes that followed, and the Caribbean cluster all merit attention. Following their locations and timing carefully gives a clearer picture than treating every point on the map as the same event. For current earthquake information, consult Panama’s Instituto de Geociencias and USGS Latest Earthquakes; follow SINAPROC for emergency guidance.
About the maps and earthquake records
These are dated snapshots, retrieved October 17, 2026. The regional map uses USGS ComCat M4+ events for October 9–16 and IGC-UP M3+ entries for western Panama and adjacent Costa Rica for October 12–16. The local catalog includes preliminary and reviewed solutions. Different networks have different detection thresholds and may report different magnitudes or locations for the same earthquake.
The timeline selects USGS M4+ events within a 30-kilometer radius of the magnitude 6.1 epicenter during the following 24 hours. That is a geographic selection, not a formal aftershock classification. All article times are Panama local time, UTC−5. Locations and magnitudes can change as agencies review data. The base map is public-domain Natural Earth data; the maps do not depict faults or rupture areas.
Download the public-source catalog snapshot (CSV) · About USGS ComCat · Natural Earth data terms.
Adapted from Ted Hannig’s October 13–14 notes, with the earthquake sequence checked and updated against primary-source catalogs. HERO’s water-monitoring observations are attributed to HERO; no independent measurement series was supplied with the notes. This article provides context rather than an official earthquake or volcanic alert.